

Mostrando entradas con la etiqueta Sociales. Mostrar todas las entradas
Mostrando entradas con la etiqueta Sociales. Mostrar todas las entradas
martes, 7 de junio de 2011

Bar chart of the number of internet users in the world.

The latest report from Forrester ForecastView ensures that the Internet population will increase in all countries the world over the coming years, but emerging markets will grow at a faster pace. In 2014, one third of Internet users come from Brazil, Russia, India or China.
The large number of online buyers and increased per capita spending on electronic commerce opens up a great business opportunity is these emerging markets with great potential who are preparing to challenge the leadership in bandwidth United States and Europe.
Map of the world´s domestic product.

The PPP is one of the most appropriate for comparing living standards that the gross domestic product per capita, as it takes into account changes in prices. This indicator eliminates money illusion linked to changes in exchange rates, so that an appreciation or depreciation of a currency will not change the purchasing power parity of a country, since the inhabitants of this country receive their wages and make purchases in the same currency. Ie, allows the exchange rates between currencies are such as to allow a coin has the same purchasing power anywhere in the world.
Map of the main tourist areas.

According to the World Tourism Organization of the United Nations, tourism comprises the activities that make people (tourists) traveling to and staying in places outside their usual environment for a consecutive period of less than one year and more than one day for leisure, business or other reasons.
In 2001 Mr. David Martin Rendón tourism Cohaíla of the Private University of Tacna - Peru, tourism is defined to science "The turismología"as: "Social Science of fact, given by an orderly process that includes different actions motivation, movement and use of space tourism, the plant that supports it, its structure and super structure of the homos turísticus "eat apples.
Map of world trade .

Concentration
Currently, the total value of merchandise exports exceed 10 billion dollars, which should add another 2 billion for the exchange of commercial services. As shown in the table below, a dozen countries, with Germany, USA and China in the lead, almost 60% of the total.
Trade in Goods. Year 2004 (billions U.S. $ s)
Expor
%
Impor
%
Balance
Germany
910
10,0
730
8,0
180
United States
820
9,0
1.520
16,7
-700
China
600
6,6
560
6,2
40
Japan
570
6,3
470
5,2
100
France
450
4,9
470
5,2
-20
Netherlands
360
4,0
320
3,5
40
Italy
350
3,8
350
3,8
0
United Kingdom
350
3,8
470
5,2
-120
Canada
320
3,5
280
3,1
40
Belgium
310
3,4
290
3,2
20
Top 10 countries
5.040
55,4
5.460
60,0
-420
Rest of World
4.060
44,6
3.640
40,0
420
World Total
9.100
100,0
9.100
100,0
0
Elaboration based on data from the World Trade Organization
In turn, in the last 25 years have seen major changes in trade flows between major areas and countries. While Asia's share has been growing steadily (now exports a quarter of the global total) of South America and Africa have declined and now do not reach 3% of the total. At the country level, the U.S. and Japan have decreased their share in global exports from 12% to 9% and 9% to 6%, respectively. Europe is the exception, since their participation has remained steady at around 45% of the world.
lunes, 14 de marzo de 2011
Primary economic activity world map .

One of the main economic activities are:
Agriculture.
Livestock.
Fishing.
Logging.
Industry.
Crafts.
Gastronomy.
Gross domestic product of countires in the world.

The PPP is one of the most appropriate for comparing living standards that the gross domestic product per capita, as it takes into account changes in prices. This indicator eliminates money illusion linked to changes in exchange rates, so that an appreciation or depreciation of a currency will not change the purchasing power parity of a country, since the inhabitants of this country receive their wages and make purchases in the same currency. Ie, allows the exchange rates between currencies are such as to allow a coin has the same purchasing power anywhere in the world.
Bar chart of income percapita of the countries E.U.

This inequality is evident in the diagram. The first bar indicates the level of income per capita in 1820 and the second in 1998, according to estimates by Maddison. The numbers in brackets located above the second bar corresponds to the average annual growth rate of the region (between 1820 and 1998).
Highlights three main elements:
* All regions were poor in 1820.
* All regions have experienced some economic progress.
* Today's rich regions experienced by far the greatest economic progress.
martes, 18 de enero de 2011


jueves, 2 de diciembre de 2010
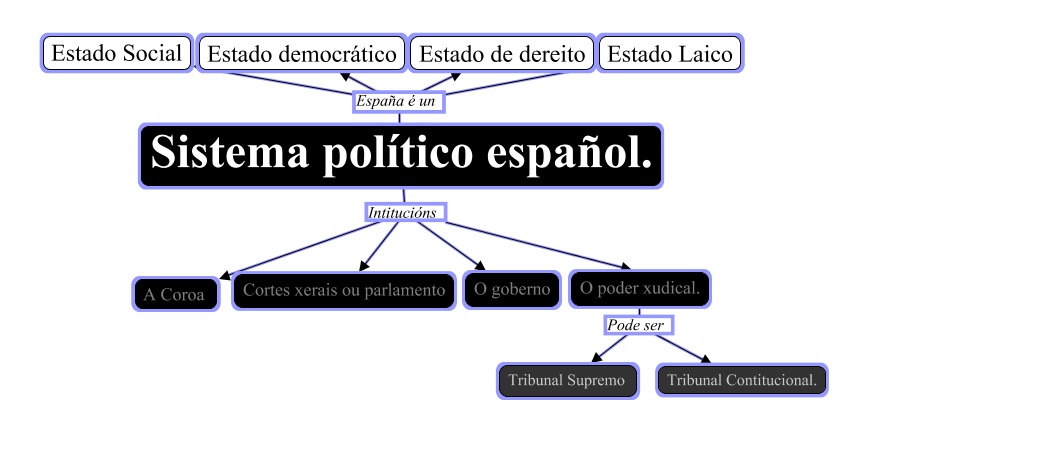
domingo, 28 de noviembre de 2010

sábado, 27 de noviembre de 2010
Population density .

The density of population estimates the number of inhabitants between the surface of the site. In general it is considered that an area is sparsely populated has a density of 10 inha./km2. And that is a very populated area if the density exceeds 80 inha./km2.
Model of population cycle.

Old or preindustrial demographic regime: it is characterized by high mortality rates and birth rates.
First transition: Keep the high birth rate, but mortality drops.
Second transition: the birth rate begins to decline, but mortality is still down more slowly.
Modern demographic regime: Mortality rates and very low birth.
Population world map.

We study:
The birth rate: is the number of births
Fertility: the estimate of children a woman would have throughout his life
Mortality: The number of deaths
To know the real crecimento a population we have the migration.
The population can be:
Activa :(16 - 64 years): the employed and who are unemployed.
Inactive: Those who can not work due to sickness and students.
Map of increse of world population.

Causes of Birth:
As the economy
VirilityThe acess married women into the labor marketThe ingnorancia (thought: Our children are going to die young mui)Psychological causes
Celivato
According to the policy
Can be prenatal (encourage them to have children) or anti-natalist (amim not to have children).
Spanish population pyramide .

A population pyramid is a graph that representing the structure of the population into age groups and sex groups .
To make a population pyramid need to know the number of its inhabitants, expressed in percentages.
Map of countries of the European Union.

Currently there are 49 independent states in Europe.
Differences:
Depending on their length: the rule is Russia's largest and the smallest Andorra
Depending on your situation: almost all have sea
Depending on their shape: Many are fragmented
According to its population: The most populated is Russia and the least populated is San marino
According to your wealth: wealthier and poorer are German and Moldova.
jueves, 21 de octubre de 2010
Ciclo da auga .

The water is continually moving. Reçber What the name of the water cycle.
1.Evaporación: The heat causes the evaporation of surface water
2.Condesación: The vapor cools affects what gives rise to clouds.
3.Precipitación: Water from the clouds falls as snow, rain or hail.
4. Part of the water fall back to cycle.
5.Unha of the water goes to rivers and lakes seas or oceans.
6. The other part of the water is absorbing of the land and form aquifers.
miércoles, 13 de octubre de 2010
Clima del Mundo

In recent years, scientific research on climate change it will Desarrollado considerably, and will be confirmed that human activities, such as Who of fossil fuels, are probably responsible for her climate change. He is warming ya TENIENDO much measurable consequences and future expected changes therein expensive and far-reaching.
How can we adapt to these changes?
¿Puedo mitigation measures to limit the magnitude of climate change and sustainable impacts. "
In 2007, he intergovernmental group of experts on it Climate Change (IPCC) tries to answer these questions through su final Assessment Report, which brings together the scientific, technical and socio-economic information about it climate change around the El Mundo. Then boil down the essential content of dich evaluation report.
Suscribirse a:
Entradas (Atom)